Akualytics.Hierarchy
8.0.2
dotnet add package Akualytics.Hierarchy --version 8.0.2
NuGet\Install-Package Akualytics.Hierarchy -Version 8.0.2
<PackageReference Include="Akualytics.Hierarchy" Version="8.0.2" />
<PackageVersion Include="Akualytics.Hierarchy" Version="8.0.2" />
<PackageReference Include="Akualytics.Hierarchy" />
paket add Akualytics.Hierarchy --version 8.0.2
#r "nuget: Akualytics.Hierarchy, 8.0.2"
#:package Akualytics.Hierarchy@8.0.2
#addin nuget:?package=Akualytics.Hierarchy&version=8.0.2
#tool nuget:?package=Akualytics.Hierarchy&version=8.0.2
Akualytics - Agentic Multidimensional Data Analytics Framework




Akualytics is a powerful .NET framework for building sophisticated AI-powered multidimensional data analytics and OLAP (Online Analytical Processing) applications. It provides a comprehensive set of tools for working with dimensional data, hierarchical structures, and complex analytical operations through both natural language AI agents and traditional programmatic approaches.
Quick Examples
New to Akualytics? → Get started from scratch
Try the Live Demo Sample App: https://flatcube.yaico.de
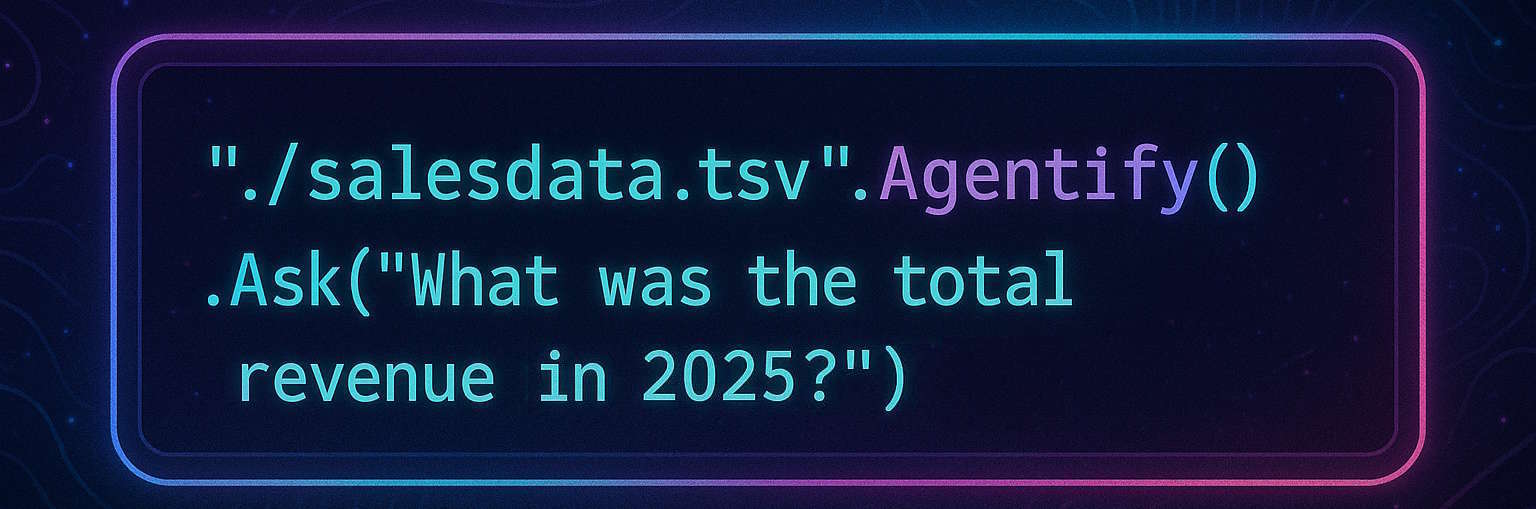
**Agentify a CSV file and query it using AI and natural language (Code) 😗*
"./salesdata.tsv".Agentify().Ask("What was the total revenue in 2025?")
Parse data file and query with YAML query (Code):
var cube = "./salesdata.tsv".ParseCubeWithMasterData()
    .RunQuery(@"
    FoldOn:
      - Supplier
    Filter:
      Date:
       - 20250101:20251231
      Measures:
        - Cost
       "
        .ConvertYamlToJsonQuery());
Traditional programmatic approach (Code):
// Define hierarchical master data
var masterdata = new[]
{
    new[] { "City", "United States", "Maryland", "Baltimore" },
    ["City", "United States", "New York", "Burlington"],
    ["City", "United States", "New Jersey", "Morristown"],
    ["Item Category", "Art & Architecture"],
    ["Item Category", "Music"],
    ["Supplier", "Publishing", "Bantam Books"],
    ["Supplier", "Publishing", "Scribner"]
}.BuildMasterDataHierarchiesFromPaths();

// Create cube from raw data and query it
var subCube = new[]
{
    new object[]
    {
        "Supplier", "City", "Item Category", "Date", "Cost", "Revenue", "Unit Price", "Units Available",
        "Units Sold"
    },
    ["Bantam Books", "Baltimore", "Art & Architecture", "2024-09-01", 38.136, 47.670, 105, 655, 454],
    ["Bantam Books", "Burlington", "Art & Architecture", "2025-08-01", 11.919, 19.866, 51, 291, 388],
    ["Scribner", "Morristown", "Music", "2024-12-01", 2.879, 4.112, 14, 541, 298]
}
.InferDataTypes()
.DoParse()
.Cubify(masterdata)
.RunQuery(new JsonQuery
{
    FoldOver = [new FoldOver { Dimension = "Supplier" }],
    Filter = [new Filter { Dimension = "Date", Criteria = ["20250101:20251231"] }]
});

// Get aggregated result
var sum = (double)subCube[Dimension.MeasureDimension.T("Cost")];
// Result: 11.919 (filtered 2025 data, aggregated across suppliers)
What is Akualytics?
Akualytics enables developers to create business intelligence and data analytics solutions with support for:
- Multidimensional Data Modeling: Build cubes with multiple dimensions like Time, Geography, Products, etc.
- OLAP Operations: Perform slice, dice, drill-down, roll-up, and pivot operations
- Hierarchical Data: Support for complex hierarchies (e.g., World → Country → State → City)
- Advanced Aggregation: Sophisticated aggregation functions with FoldOn/FoldOver operations
- Query Language: YAML and JSON-based query languages for analytical operations
- AI Integration: Natural language query processing capabilities
Author
Chris Aussem - Creator & Maintainer
- LinkedIn: Chris Aussem
- GitHub: @Qrist0ph
- Company: yaico
Core Use Cases
- Business Intelligence Dashboards: Create interactive BI applications
- Financial Reporting: Multi-dimensional financial analysis and reporting
- Sales Analytics: Geographic and temporal sales analysis
- Inventory Management: Hierarchical product category analysis
- Performance Monitoring: KPI tracking across multiple dimensions
Data Model Architecture
The framework is built around a hierarchical data model that flows from simple dimensions to complex analytical cubes:
graph TD
    D[Dimension<br/>🔴<br/>Value: object<br/>IsMeasure: bool]
    TE[TupleElement<br/>🟢<br/>Value: object<br/>Dimension: IDimension]
    T[Tupl<br/>🔵<br/>Elements: TupleElement<br/>Schema: Schema<br/>Value: object]
    S[Schema<br/>🟡<br/>Dimensions: IDimension<br/>Count: int]
    DF[DataFrame<br/>🟣<br/>Schema: Schema<br/>Tuples: Tupl]
    C[Cube<br/>🟪<br/>Schema: Schema<br/>OLAP Operations<br/>Masterdata: Tupl]
    AC[AgenticCube<br/>🤖<br/>AI Integration<br/>Natural Language<br/>Query Processing]
    HN[HierarchyNode<br/>🟠<br/>Wrapee: object<br/>Children: HierarchyNode<br/>Parent: HierarchyNode]

    %% Core composition relationships (inverted)
    TE -->|references| D
    T -->|contains 1..*| TE
    S -->|defines| D
    T -->|validates| S
    DF -->|aggregates into| T
    C -->|aggregates into| T
    DF -->|structures| S
    C -->|structures| S

    %% Agentic relationship
    AC -->|Agentify| C

    %% Hierarchical relationships (inverted)
    TE -->|provides value for| HN
    HN -->|parent/child| HN
    C -->|master data for| HN

    %% Data flow direction (inverted)
    C -->|cubify| DF

    %% Styling
    style D fill:#ff6b6b,stroke:#333,stroke-width:3px,color:#fff
    style TE fill:#4ecdc4,stroke:#333,stroke-width:3px,color:#fff
    style T fill:#45b7d1,stroke:#333,stroke-width:3px,color:#fff
    style S fill:#f9ca24,stroke:#333,stroke-width:3px,color:#333
    style DF fill:#6c5ce7,stroke:#333,stroke-width:3px,color:#fff
    style C fill:#a29bfe,stroke:#333,stroke-width:3px,color:#fff
    style AC fill:#00b894,stroke:#333,stroke-width:3px,color:#fff
    style HN fill:#fd79a8,stroke:#333,stroke-width:3px,color:#fff
Core Components
🔴 Dimension
The fundamental building block representing categorical data axes (e.g., "City", "Product", "Date", "Revenue").
🟢 TupleElement
Combines a dimension with a specific value (e.g., City="Berlin", Revenue=1000).
🔵 Tupl
A collection of tuple elements representing a point in multidimensional space. Represents a single data record across multiple dimensions.
🟡 Schema
Defines the structure by specifying which dimensions are used and their order.
🟣 DataFrame
A collection of tuples with the same schema, representing tabular data with consistent structure.
🟪 Cube
The analytical engine that provides OLAP operations on multidimensional data, supporting complex queries and aggregations.
🤖 AgenticCube
AI-enhanced cube that enables natural language query processing, allowing users to interact with multidimensional data using plain English questions and commands.
🟠 HierarchyNode
Enables hierarchical master data structures for drill-down and roll-up operations across dimensional hierarchies.
Key Features
- Type-safe Dimensional Modeling: Strongly typed dimensions and tuple operations
- Fluent API: Intuitive method chaining for building complex queries
- Performance Optimized: Efficient algorithms for large-scale data processing
- Extensible Architecture: Plugin system for custom data providers and functions
- Serialization Support: JSON and XML serialization for data persistence
- Master Data Integration: Built-in support for hierarchical master data
Getting Started
Check out the comprehensive lessons in Akualytics.Core.Tests/Lessons/ to learn:
- Lesson 1: Data Model basics
- Lesson 2: Tuple operations
- Lesson 3: DataFrame operations
- Lesson 4: Cube operations and aggregations
- Lesson 5: Hierarchical data handling
- Lesson 6: Loading data into cubes
- Lesson 7: Querying cubes with YAML/JSON
- Lesson 8: AI integration and natural language queries
Example Usage
// Create a simple cube
var cube = new[]
{
    new Tupl(["City".D("Berlin"), "Product".D("Laptop"), "Revenue".D(1000d, true)]),
    new Tupl(["City".D("Munich"), "Product".D("Phone"), "Revenue".D(500d, true)])
}
.ToDataFrame()
.Cubify();

// Query the cube
var berlinRevenue = cube["City".T("Berlin").And("Revenue".D())];
Akualytics provides the foundation for building enterprise-grade analytical applications with the power and flexibility of multidimensional data modeling.
Core Concepts: Cube Folding / Tuple AND
Folding is one of the key operations in Akualytics for dimensional aggregation and data reduction.
AND Operation is one of the key operations on tuples
Fold Over using Sum
Example: Product Revenue by Month
| Product | Jan | Feb | Mar | Apr | May | Jun |
|---|---|---|---|---|---|---|
| Laptop Pro | $15,500 | $22,100 | $19,800 | $24,600 | ||
| Mobile Phone | $8,900 | $12,300 | $18,200 | |||
| Tablet Elite | $9,400 | $8,600 | $10,200 | |||
| Smart Watch | $4,100 | $5,600 | ||||
| Headphones | $2,100 | $3,200 |
var result = cube.FoldOver(new Schema(["Month".D()]), df => df.Sum(t => (double)t.Value));
Folding this table over the Time dimension applying SUM results in:
After FoldOver Month Dimension using SUM as Aggregation
| Product | Total Revenue (Jan-Jun) |
|---|---|
| Laptop Pro | $82,000 |
| Mobile Phone | $39,400 |
| Tablet Elite | $28,200 |
| Smart Watch | $9,700 |
| Headphones | $5,300 |
Fold Over using Most Recent Aggregation
Example: Product Stock Levels by Month
| Product | Jan | Feb | Mar | Apr | May | Jun |
|---|---|---|---|---|---|---|
| Laptop Pro | 150 | 180 | 165 | 220 | ||
| Mobile Phone | 89 | 105 | 142 | |||
| Tablet Elite | 75 | 68 | 82 | |||
| Smart Watch | 45 | 58 | ||||
| Headphones | 25 | 35 |
var result = cube.FoldOver(new Schema(["Month".D()]), df => df.OrderBy(t => t["Date".D()]).Last().Value);
Folding this table over the Time dimension applying MOST RECENT results in:
After FoldOver Month Dimension using MOST RECENT as Aggregation
| Product | Most Recent Stock Level |
|---|---|
| Laptop Pro | 220 |
| Mobile Phone | 142 |
| Tablet Elite | 82 |
| Smart Watch | 58 |
| Headphones | 35 |
Tuple And vs AndOverwrite
Tuple operations are fundamental for combining multidimensional data points. The And and AndOverwrite operations allow you to merge tuples but handle dimension conflicts differently.
And Operation - Strict Combination
The And operation combines two tuples by merging their dimensions. If there are conflicting values for the same dimension, it returns null.
Example:
var tuple1 = "City".T("Burlington").And("Supplier".T("Bantam Books"));
var tuple2 = "Product".T("Laptop");
var result = tuple1.And(tuple2);
// Result: City="Burlington", Supplier="Bantam Books", Product="Laptop"
AndOverwrite Operation - Conflict Resolution
The AndOverwrite operation combines tuples but resolves conflicts by using values from the second tuple (overwriting the first).
Example with Conflict:
var tuple1 = new Tupl([
    "City".D("Burlington"),
    "Supplier".D("Bantam Books"),
    "Product".D("Car")
]);
var tuple2 = new Tupl([
    "City".D("Detroit"),
    "Supplier".D("Bantam Books")
]);

var andResult = tuple1.And(tuple2);           // Returns null (conflict on City)
var overwriteResult = tuple1.AndOverwrite(tuple2); // City="Detroit", Supplier="Bantam Books", Product="Car"
| Operation | Conflict Handling | Use Case |
|---|---|---|
| And | Returns null | When data integrity requires no conflicts |
| AndOverwrite | Second tuple wins | When you need to update/merge conflicting data |
| Product | Versions Compatible and additional computed target framework versions. |
|---|---|
| .NET | net9.0 is compatible. net9.0-android was computed. net9.0-browser was computed. net9.0-ios was computed. net9.0-maccatalyst was computed. net9.0-macos was computed. net9.0-tvos was computed. net9.0-windows was computed. net10.0 was computed. net10.0-android was computed. net10.0-browser was computed. net10.0-ios was computed. net10.0-maccatalyst was computed. net10.0-macos was computed. net10.0-tvos was computed. net10.0-windows was computed. |
-
net9.0
- Newtonsoft.Json (>= 12.0.3)
NuGet packages (2)
Showing the top 2 NuGet packages that depend on Akualytics.Hierarchy:
| Package | Downloads |
|---|---|
|
Akualytics.Core
Akualytics Agentic OLAP Library - Core analytical cube and data processing functionality. Created by Chris Aussem (LinkedIn: https://linkedin.com/in/chris-aussem/) |
|
|
Akualytics.Agentic
Akualytics Agentic OLAP Library - AI-powered analytical extensions and agent capabilities. Created by Chris Aussem (LinkedIn: https://linkedin.com/in/chris-aussem/) |
GitHub repositories
This package is not used by any popular GitHub repositories.